
PokeForecast tracks pricing, sales volume, grading information and market movement across the Pokemon TCG secondary market.
This page is designed as a reference for collectors, publishers and researchers who want to understand what the market data means, how it is calculated and how to cite it accurately.
The live modules below update with PokeForecast, while the surrounding explanations provide context for interpreting the numbers.
Using PokeForecast Data
Publishers, journalists, researchers and content creators may cite statistics from this page with attribution to PokeForecast and a link to this page. Because Pokemon card prices and sales activity change over time, please include the date accessed when citing current figures.
PokeForecast Pokemon Market Index
The PokeForecast Pokemon Market Index is designed to show the direction of the broader Pokemon card market rather than the movement of a single card, set or release.
The index is calculated from English Pokemon cards with qualifying market price data.
Cards priced below $1 are excluded so thousands of low value cards do not dominate the index. Extreme prices that are more likely to represent placeholder listings or unreliable source data are also filtered.
PokeForecast also checks the amount of usable pricing data available each day. Days with insufficient market coverage are treated as data gaps rather than genuine market declines.
The result is intended to provide a consistent view of the part of the Pokemon card market that PokeForecast can reliably observe.
The Market Index should not be interpreted as the total value of every Pokemon card in existence. It is a market indicator built from cards with qualifying price data in the PokeForecast database.
Historical pricing data currently begins on May 19, 2026. The available history grows by one day every day.
Read the full PokeForecast methodology
How to Read the Market Index
The percentage changes shown in the Market Index measure how the aggregate value of qualifying cards has changed over different periods.
A rising index means the combined value of the cards included in the calculation has increased. A falling index means the combined value has declined.
That does not mean every Pokemon card is moving in the same direction.
Vintage cards can strengthen while newer cards decline. One set may be rising while another loses value. Individual chase cards can also move sharply without having much effect on the broader market.
The index is therefore most useful as a broad market signal rather than a prediction for any specific card.
Shorter periods such as seven days are more sensitive to sudden market changes. Thirty and ninety day comparisons provide more context and reduce some of the short term noise.
Most Traded Pokemon Cards
Price tells you what a card may be worth. Sales volume tells you whether collectors are actually buying it.
PokeForecast tracks completed eBay transactions across raw and graded copies and uses that information to identify cards with the highest trading activity.
 1
Psyduck
Ascended Heroes · 226
46/wk
$49.82
1
Psyduck
Ascended Heroes · 226
46/wk
$49.82
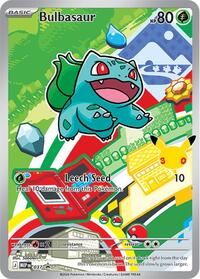 2
Bulbasaur
Mega Evolution Promos · 037
46/wk
$20.37
2
Bulbasaur
Mega Evolution Promos · 037
46/wk
$20.37
 3
Clefairy
Perfect Order · 94
46/wk
$12.05
3
Clefairy
Perfect Order · 94
46/wk
$12.05
 4
Slowbro
Abyss Eye · 87 JP
46/wk
$5.73
4
Slowbro
Abyss Eye · 87 JP
46/wk
$5.73
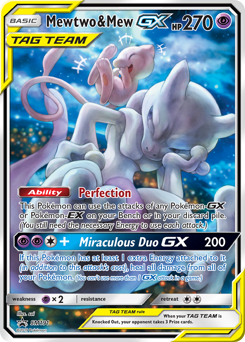 5
Mewtwo & Mew-GX
SM Black Star Promos · SM191
45/wk
$385
5
Mewtwo & Mew-GX
SM Black Star Promos · SM191
45/wk
$385
 6
Mega Gengar ex
Ascended Heroes · 269
45/wk
$36.97
6
Mega Gengar ex
Ascended Heroes · 269
45/wk
$36.97
 7
Entei
Wizards Black Star Promos · 34
45/wk
$28.81
7
Entei
Wizards Black Star Promos · 34
45/wk
$28.81
 8
Charmander
Mega Evolution Promos · 038
45/wk
$26.61
8
Charmander
Mega Evolution Promos · 038
45/wk
$26.61
 9
Greninja ★
SWSH Black Star Promos · SWSH144
45/wk
$19.85
9
Greninja ★
SWSH Black Star Promos · SWSH144
45/wk
$19.85
 10
Mega Charizard X ex
Phantasmal Flames · 109
45/wk
$18.80
10
Mega Charizard X ex
Phantasmal Flames · 109
45/wk
$18.80
The ranking is based on completed transactions rather than active listings.
Sales are measured over a broader period and converted into an average weekly figure. This helps prevent one unusually busy day from dominating the rankings.
Cards below $5 are excluded from the main ranking so high volume bulk cards do not overwhelm cards collectors are more actively following.
When cards have similar sales volume, the amount of money moving through the market can also help distinguish which cards are seeing the strongest overall activity.
Sales volume is especially useful when combined with price movement.
A card rising 20% while selling dozens of copies each week presents a different market picture from a card rising the same amount after only a handful of transactions.
View the full Most Traded rankings
Pokemon Card Market Movers
Large percentage changes can look impressive, but percentage change alone does not tell us whether a move is meaningful.
A card with limited pricing history or very few transactions can sometimes show a dramatic gain or decline even when little market activity sits behind it.
PokeForecast Market Movers is designed to reduce that problem.
7 Day Market Movers



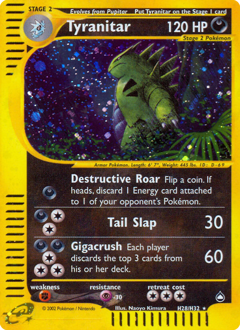
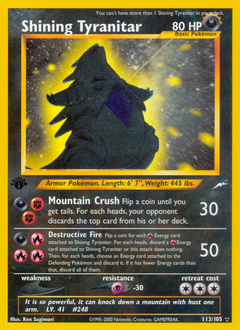

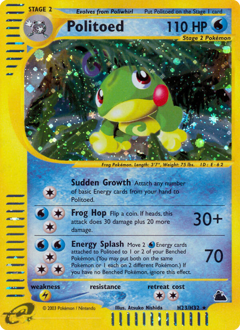
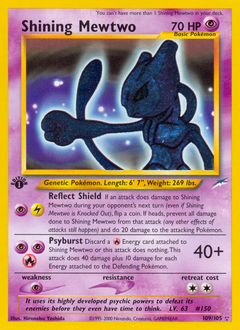
Seven day movement is useful for identifying cards attracting attention right now.
Short term changes can also be influenced by new product releases, temporary supply shortages, sudden collector interest or individual sales, so these moves should be interpreted with more caution.
30 Day Market Movers



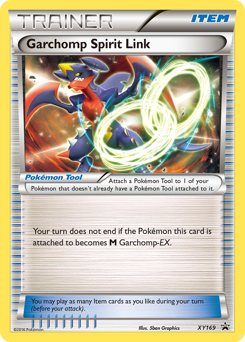
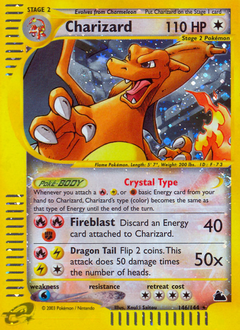
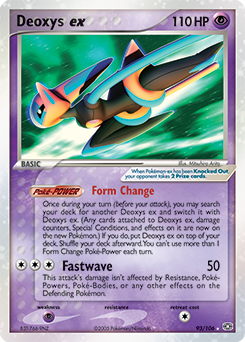

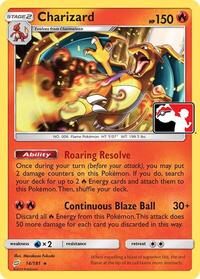

The 30 day view removes more of the short term noise and can provide a better indication of whether a move is developing into a broader trend.
Market Movers uses minimum pricing requirements, price coverage and filtering to reduce misleading percentage changes.
Both the starting and ending values must meet qualifying price requirements, and cards need enough usable observations across the period being measured.
Extreme readings that are more likely to be pricing errors or temporary data artifacts can also be removed.
Why Liquidity Matters
Two cards can show the same price increase while having very different markets behind them.
PokeForecast uses a Liquidity Score from 0 to 10 to show how much underlying data supports a card’s market movement.
The score considers factors such as pricing coverage, sales activity and the number of usable market observations supporting the move.
A higher score generally means the card has a deeper market and more data behind its current price.
A lower score does not automatically mean the price is wrong. It means there is less market activity supporting the number and therefore more uncertainty.
As a general guide:
7 to 10: relatively deep market activity
4 to 7: moderate liquidity
Below 4: thinner market data
Liquidity is one of the reasons PokeForecast does not treat every large percentage move equally.
A 30% increase backed by frequent transactions and consistent pricing carries more information than the same increase on a card that rarely sells.
Read how PokeForecast calculates Market Movers and Liquidity Score
Pokemon Market by Segment
The overall Pokemon card market can move in one direction while different parts of the market behave very differently.
PokeForecast breaks the market down by era and price range to show where value is actually moving. This makes it easier to see whether current strength is concentrated in vintage cards, modern releases, lower priced cards or the higher end of the market.
Market by segment
| Segment | 30-day change | Cards |
|---|---|---|
| Vintage 1999 to 2007 | +10.9% | 3,353 |
| Mid-era 2008 to 2019 | +4.1% | 4,181 |
| Modern 2020 to present | -5.3% | 2,993 |
| Cards $5 to $25 by price at the start of the window | +1.8% | 3,819 |
| Cards $25 to $100 by price at the start of the window | +2.7% | 1,881 |
| Cards $100 and up by price at the start of the window | +6.7% | 970 |
Change over 30 days to October 2, 2026, from completed Near Mint sales. Only cards priced in both windows are counted, on both sides, so cards entering the catalogue cannot read as a price rise. Price bands are fixed by each card's price at the start of the window. Eras are by set release year: vintage 1999 to 2007, mid-era 2008 to 2019, modern 2020 onwards.
These comparisons use the same qualifying price data behind the broader PokeForecast Market Index, but separate cards into different segments before measuring their movement.
That distinction matters. A rising overall index does not necessarily mean every part of the Pokemon market is strengthening at the same pace. Vintage cards may outperform modern cards during one period, while another period may be driven primarily by newer releases or higher priced collectibles.
Price ranges provide another view of the same market. Movement among lower priced cards can reflect very different collector behavior than movement among cards valued at $100 or more.
Tracking these segments over time helps show where demand is becoming stronger or weaker instead of relying only on the direction of the market as a whole.
How PokeForecast Calculates Set Values
PokeForecast also tracks the estimated value of Pokemon TCG sets.
Set values are built from the current Near Mint market prices of cards included in each release, including additional printings and variants where they are tracked.
The important part is how changes over time are calculated.
When comparing a set today with its value 30 or 90 days ago, PokeForecast only compares cards that had qualifying price data on both dates.
This prevents newly added pricing data from making a set appear to have increased in value when the cards themselves did not actually move.
The same principle applies when source data is incomplete. A day with large amounts of missing pricing information should not be interpreted as a genuine collapse in set value.
This approach makes set movement more useful for understanding whether value is actually changing across a release.
Browse Pokemon TCG sets and current values
How PokeForecast Uses Grading Data
Raw market price is only one part of a Pokemon card’s value.
PokeForecast also incorporates completed graded sales and population information where available.
Graded values are based on completed transactions rather than active asking prices. The number of sales supporting each value is important because a grade based on a large number of transactions provides more market evidence than one supported by only a few sales.
Population data helps show how many graded copies exist and how that supply is distributed across different grades.
That can provide useful context when comparing raw prices with PSA, CGC, BGS or SGC values.
For example, a large PSA 10 premium can appear attractive, but that premium needs to be considered alongside the number of existing PSA 10 copies, the rate at which new copies are being graded and the probability that a raw card can actually achieve that grade.
PokeForecast grading ROI calculations also account for estimated grading costs.
A high calculated return does not guarantee that grading a card will be profitable. Condition, shipping, grading fees, turnaround time and the actual grade received can all change the outcome.
Read more about PokeForecast grading calculations
Record Sales and Exceptional Transactions
Record sales are tracked separately from the repeatable market data used elsewhere on PokeForecast.
A rare Pokemon card selling for hundreds of thousands or millions of dollars can be historically important without telling us what another copy will sell for tomorrow.
For that reason, unusual auction results and major private transactions are not allowed to distort the Market Index, normal card pricing or Market Movers.
PokeForecast manually tracks major documented sales where a source can be checked.
Public auction results, eBay sales and reported private transactions are labeled separately when that distinction matters.
The site uses the term highest recorded sale rather than highest sale ever because some private transactions may never become public.
Recent Verified Pokemon Card Sales
-
 Pikachu Illustrator
Trophy & Legendary Promos · PSA 10
Goldin · 16 Feb 2026 · source
$16,492,000
Pikachu Illustrator
Trophy & Legendary Promos · PSA 10
Goldin · 16 Feb 2026 · source
$16,492,000
-
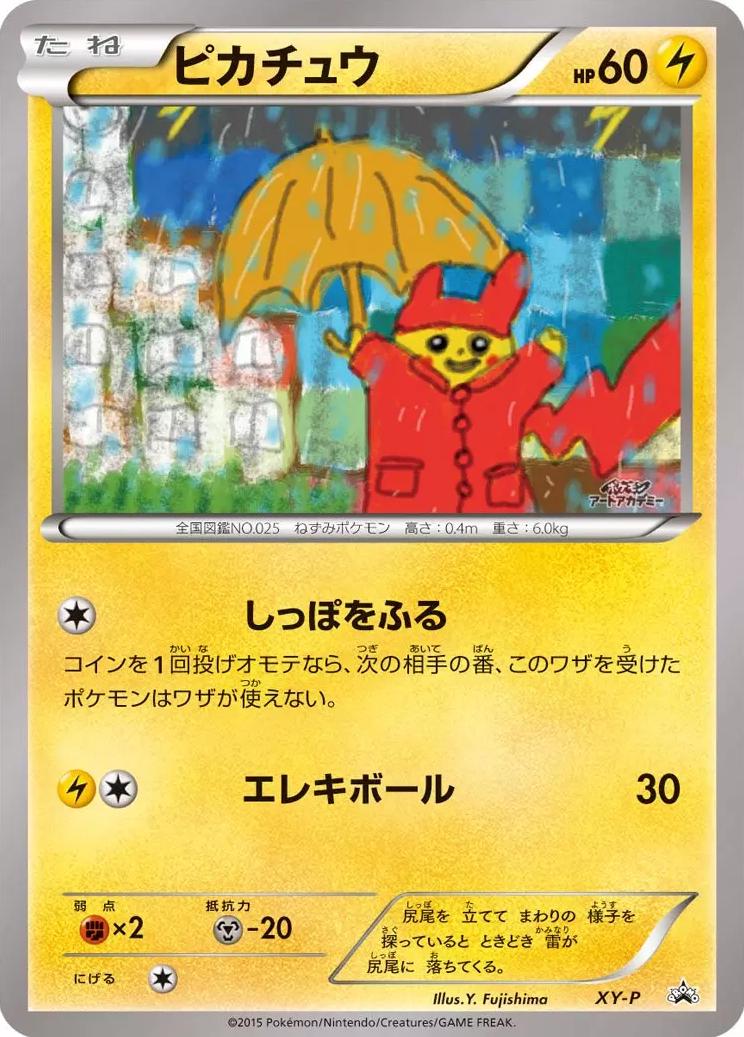 Pikachu Art Academy
XY Promos · PSA 10
Fanatics Collect · 28 Sep 2026 · source
$8,400,000
Pikachu Art Academy
XY Promos · PSA 10
Fanatics Collect · 28 Sep 2026 · source
$8,400,000
-
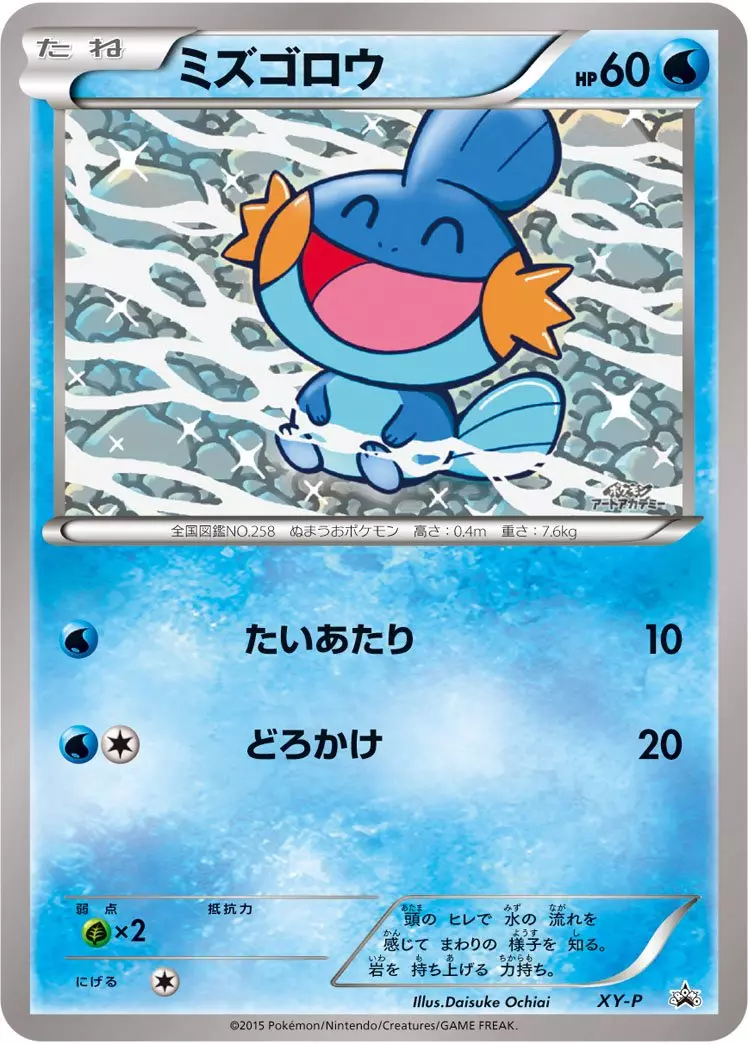 Art Academy Mudkip
XY Promos · PSA 10
Fanatics Collect · 25 Sep 2026 · source
$3,720,000
Art Academy Mudkip
XY Promos · PSA 10
Fanatics Collect · 25 Sep 2026 · source
$3,720,000
-
 Torchic ★
Team Rocket Returns · PSA 10
Alt · 10 Sep 2026 · source
$2,700,000
Torchic ★
Team Rocket Returns · PSA 10
Alt · 10 Sep 2026 · source
$2,700,000
-
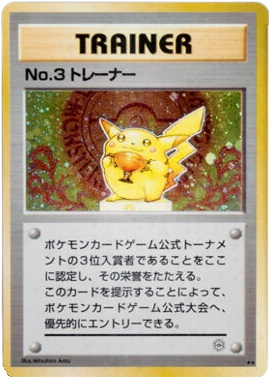 No.3 Trainer
Trophy & Legendary Promos · PSA 10
Goldin · 18 May 2026 · source
$1,769,000
No.3 Trainer
Trophy & Legendary Promos · PSA 10
Goldin · 18 May 2026 · source
$1,769,000
Every sale here is recorded by hand and linked to its source. Public auction results are listed as they stand; eBay and private sales are marked as such, because a reported private figure is not the same claim as a public auction result and should not rank beside one unmarked. Prices elsewhere on this site come from TCGplayer listings and completed eBay sales, which is why these are listed separately.
These sales provide useful market history, but they should be interpreted differently from prices supported by repeated transactions.
PokeForecast Data Sources
PokeForecast combines several types of market information rather than relying on one source.
Raw card pricing is primarily based on TCGplayer market data through TCGCSV’s daily mirror of TCGplayer’s public market feed.
That information powers raw card values, historical price movement, set values and the PokeForecast Market Index.
Additional information such as completed eBay sales, graded sales and grading population data is incorporated where available.
Different parts of the site use different time periods and minimum data requirements depending on what is being measured.
Pricing data refreshes daily, while some individual card tools use longer averaging periods to reduce short term noise.
PokeForecast’s historical pricing database currently begins on May 19, 2026.
No market database is perfect.
Pokemon cards can trade infrequently, marketplaces can disagree and unusual listings can temporarily create bad readings.
PokeForecast uses filtering, minimum coverage requirements and liquidity measures to reduce those problems rather than pretending they do not exist.
Read the complete PokeForecast methodology
What the Data Can and Cannot Tell You
Market data becomes more useful when several signals point in the same direction.
A rising price supported by frequent sales and consistent pricing provides more information than the same increase on a card with very little activity.
The same applies to grading.
A large PSA 10 premium means something different when the population is small and stable than when hundreds of new copies are entering the population each month.
PokeForecast is designed to combine these signals so collectors can understand what sits behind a price rather than seeing only one number.
Market data still cannot predict every future move.
Reprints, product restocks, tournament results, collector trends, grading supply and broader changes in demand can all affect prices.
Historical data describes what has happened. Current market data shows what is happening now. Forecasts remain estimates rather than guarantees.
Citing PokeForecast
Publishers, journalists, researchers, YouTubers, podcasters and other content creators may reference statistics published by PokeForecast.
When citing current market figures, please attribute the information to PokeForecast and link to:
https://pokeforecast.com/market-data
Because card prices, sales volume and grading information change continuously, please include the date the data was accessed.
Examples:
“According to PokeForecast, [card name] was one of the most actively traded Pokemon cards as of [date].”
“The PokeForecast Pokemon Market Index increased [X%] over the previous 30 days as of [date].”
“PokeForecast data showed [card name] rising [X%] over 30 days with a Liquidity Score of [X] as of [date].”
Linking to the Market Data page allows readers to see both the current figures and how those statistics are calculated.
Media and Data Requests
Working on a story, article, video, podcast or research project involving the Pokemon card market?
PokeForecast can help with historical card pricing, sales volume, grading populations, graded sales, set values and broader Pokemon TCG market trends.
For questions about the data or requests for additional market information, contact:
If you find a market figure that appears incorrect, include the card or page URL and the number you expected to see so the underlying data can be checked directly.